
That's a title! Not too long ago I put together a .Net client for InfluxDB. I then found myself in a discussion of monitoring some time series data on Windows. Since I like fiddling and having fun while programming, I set off to create a small "util/sample/POC". The result is "Digger".
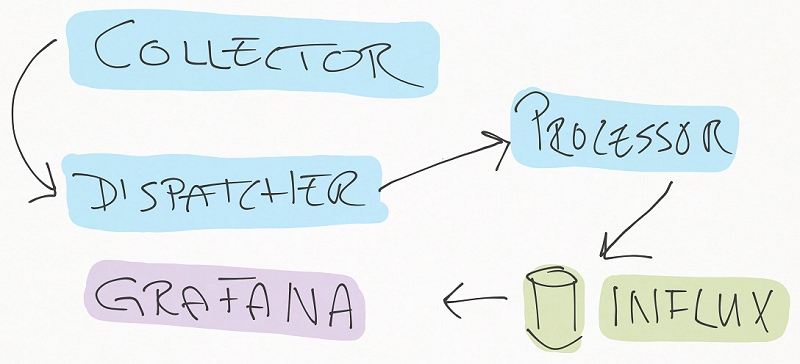
Digger is designed to run as a Windows service (using TopShelf). The idea is that it has configurable Collectors that collects time series data that then, via a Dispatcher, is forwarded to a Processor that e.g. stores the data in InfluxDB. From this, you can then create dashboards in Grafana.
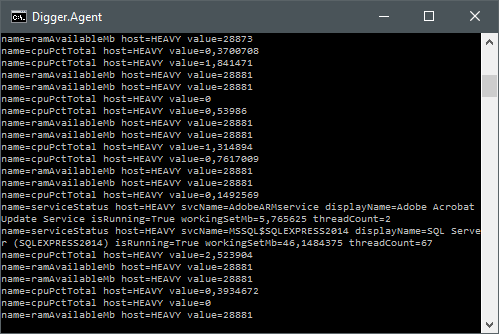
Just firing it up as a console instead of a service gives:
Logging
Since things goes wrong every now and then. Serilog is hooked in and used for logging. Configure the file target in App.config.
Collectors
Collectors collects data and transforms the data to IMeasurement instances that carries MeasurementPoint(s). They are configured dynamically in: digger.agent.conf. The location of this file is determined by App.config.
Currently, the supported collectors are:
- Performance counters (arbitrary, configure what you want)
- Windows Services using WMI (State, ThreadCount, WorkingSetMb)
- WebHooks
Performance Counter Collector
Produces PerformanceCounterMeasurement. You define what performance counters to monitor and how often they should be extracted in the digger.agent.conf.
{
  "collectors": [
    {
      "type": "PerformanceCounterCollector",
      "name": "cpuPctTotal",
      "collectInterval": "00:00:01.000",
      "performanceCounterConfig": {
        "categoryName": "Processor",
        "counterName": "% Processor Time",
        "instanceName": "_Total"
      }
    },
    {
      "type": "PerformanceCounterCollector",
      "name": "ramAvailableMb",
      "collectInterval": "00:00:01.000",
      "performanceCounterConfig": {
        "categoryName": "Memory",
        "counterName": "Available MBytes"
      }
    }
  ]
}
Windows Service Status Collector
Produces WinServiceStatusMeasurement. You can have many WinServiceStatusCollector configured, but that would only make sense if you would like different collectInterval or inclussion of process info (includeProcessInfo) for different services (serviceNames).
{
  "collectors": [
    {
      "type": "WinServiceStatusCollector",
      "name": "serviceStatus",
      "collectInterval": "00:00:15.000",
      "includeProcessInfo": true,
      "serviceNames": [
          "MSSQL$SQLEXPRESS2014",
          "AdobeARMservice" ]
    }
  ]
}
WebHooksCollector
Produces WebHookMeasurement. There's an embeded ASP.Net WebAPI hosted in the Digger.Agent. You can use this to accept e.g. POSTS of web hooks from Mandrill or something and transform them to points.
{
  "collectors": [
    {
      "type": "WebHooksCollector",
      "baseAddress": "http://127.0.0.1:62333"
    }
  ]
}
Custom collector
There's a small ICollector interface that you need to implement.
    public interface ICollector
    {
        bool IsStarted { get; }
        void Start();
        void Stop();
    }
If you want an asynchronous collector, running in it's own Task, then you can extend AsyncPollingCollectorBase.
Dispatchers
The dispatchers accepts an IMeasurement that is dispatched to IProcessors. There are currently two implementations:
- ImmediateInProcessDispatcher
- QueuedInProcessDispatcher
Which one to use is defined in the config:
{
  "dispatcherType":
      "Digger.Agent.Dispatchers.QueuedInProcessDispatcher, Digger.Agent"
}
Processors
The processors is what processes the collected IMeasurements and their Points. There are two processors:
- ConsoleProcessor
- QueuedInfluxDbProcessor
When just running the application manually, e.g. by pressing (F5) in Visual Studio, it will use the ConsoleProcessor. Otherwise the InfluxDbProcessor will be used. You can tweak this in Digger.Agent.Bootstrap.ProcessorsModule.
The current supported configuration options for Processors, are:
{
  "processors": {
    "influxDb": {
      "host": "http://ubuntu01:9086",
      "database": "digger"
    }
  }
}
In code there's support for having different measurements sent to different InfluxDbTargetInfo, but there's no config support for that yet so, the above will be used as the sinlge target.
Then what
Well, lets try it. Let's just hit F5 in Visual Studio and see what happens.

OK, but lets get the data into InfluxDB. For demo, I'm still going to run it from within Visual Studio, so in: Digger.Agent.Bootstrap.ProcessorsModule, I'll just ensure that the InfluxProcessor is used, by commenting out the ConsoleProcessor. If running as a service, this should not be needed. This is just for demo.
public class ProcessorsModule : NinjectModule
{
    public override void Load()
    {
        //if (Environment.UserInteractive)
        //    RegisterProcessor<ConsoleProcessor>();
        //else
            RegisterInfluxDbProcessor();
    }

    //... other stuff removed ...
}
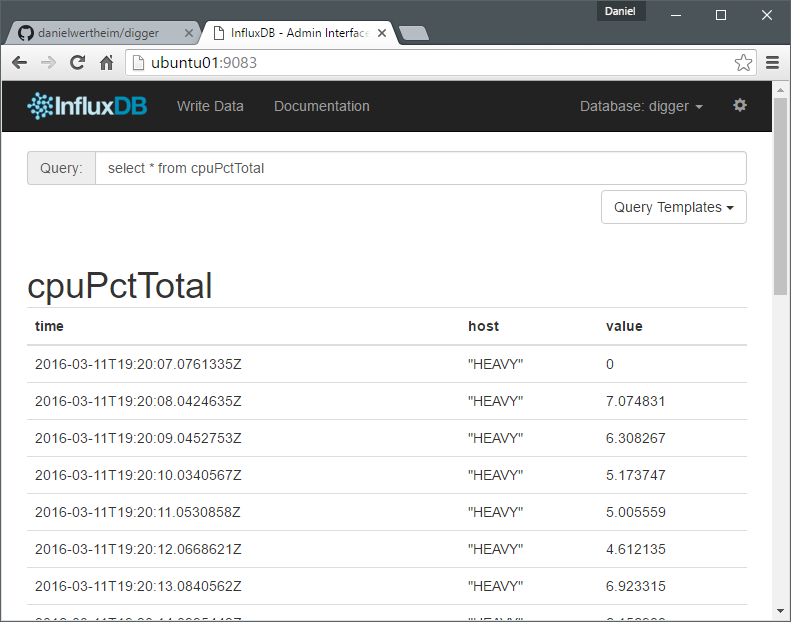
Now, create a database in InfluxDB. Name it according to configuration "digger". Ensure the host is correct. Then just hit F5 and have a look in InfluxDB.
Configuration:
{
  "processors": {
    "influxDb": {
      "host": "http://ubuntu01:9086",
      "database": "digger"
    }
  }
}
Then you can just fire up Grafana and easily create a dashboard looking something like:

Going further
I haven't decided what to do with this. Maybe you want to fork it. Use it. Contribute. Get inspired by it.... Or just have fun, giggling at some code decisions I made. Anyway. Hope it has provided something.
Cheers,
//Daniel