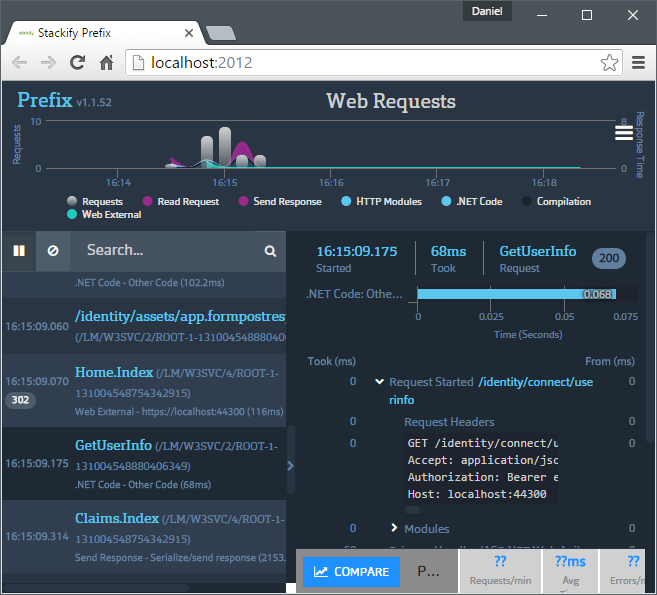
Prefix is a free profiler for your .Net applications built by Stackify. In this post we will look at getting it up and running and putting it to simple use. Further usage will be covered in future posts. My impressions after this first post and usage is:
It's super easy to get started! And you are well taken care of, being guided to docs on what to do next.
There's now a second post: "Some more time with Prefix from Stackify"; shoing how it works with MongoDb and NLog.
Key features
Taken from Prefix docs
- Find slow SQL queries, web service calls, etc
- View logging, Debug, & Trace statements
- Runs only on a developer’s workstation. No server installs.
- Supports 30+ common .NET libraries (view list)
- Runs in the background and is always there when you need it
30+ common .NET libraries
Not bad. Just going to highlight some of them (full list):
- MVC
- Web API
- Nancy
- ServiceStack
- Owin
- WCF
- Redis
- NServicebus
- MongoDB
- Elastic
- RavenDB
- SQL Server
- MySql
- Postgres
- ...
- ...
Installing
Prefix is distributed as a unified installer. The installation process is really simple. Download and install. There are no options, so it would be really easy to distribute it via e.g. Chocolatey.
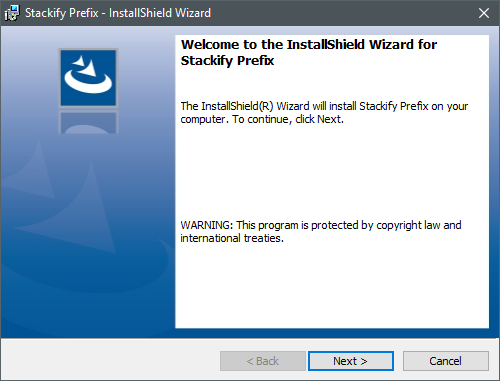
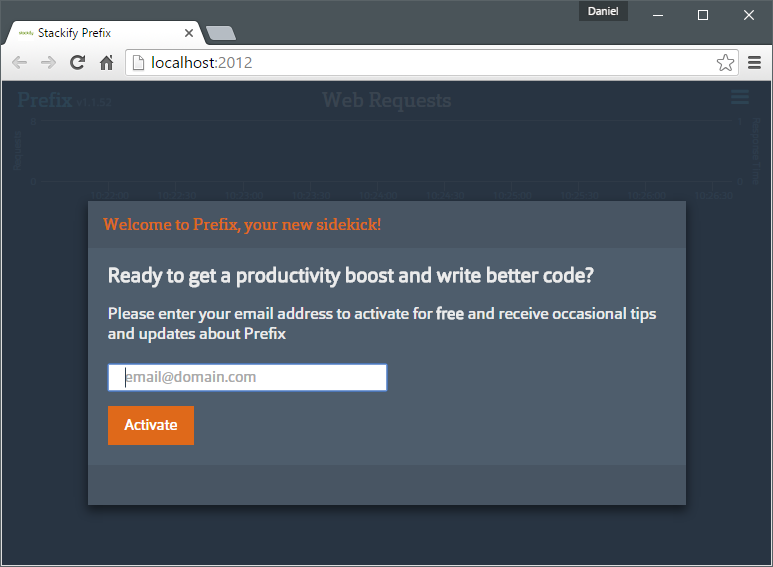
The installer is really quick and it opens the default browser presenting you with a welcome/activation screen. Enter your email and activate.
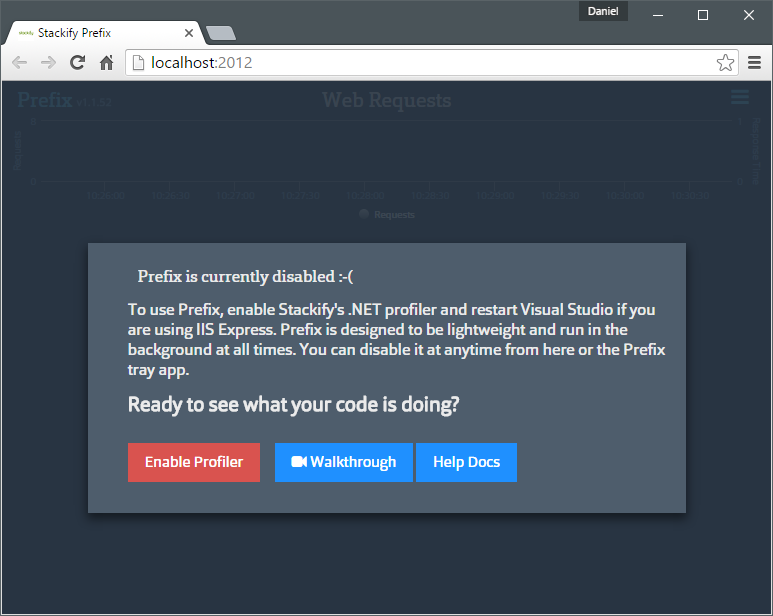
After activation you need to enable the profiler before you are ready to go.
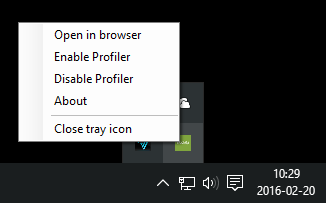
It's also kind enough to install a tray icon, so that you can reach the local web application as well as disable and enable the profiler.
How about usage data?
I do understand that software distributors want to collect usage data from their software. How ever, I do not like:
- when it's hidden from me
- when it's on by default
- when it's something I can't turn off
How did I find out about it? Well, it's a profiling tool, so the least I can do is to look at the network utilization, right? Even with the profiler disabled I found this:
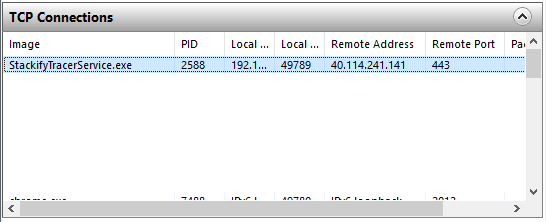
I asked Stackify about it, and got the answer that it was usage data. And looking at the remote IP address, it seems to be using the Microsoft Application Insights.
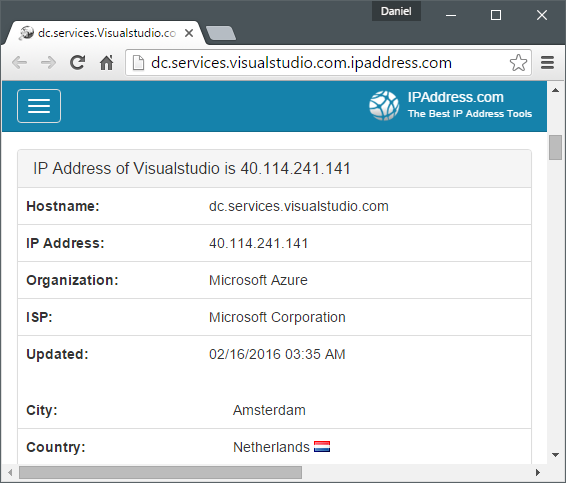
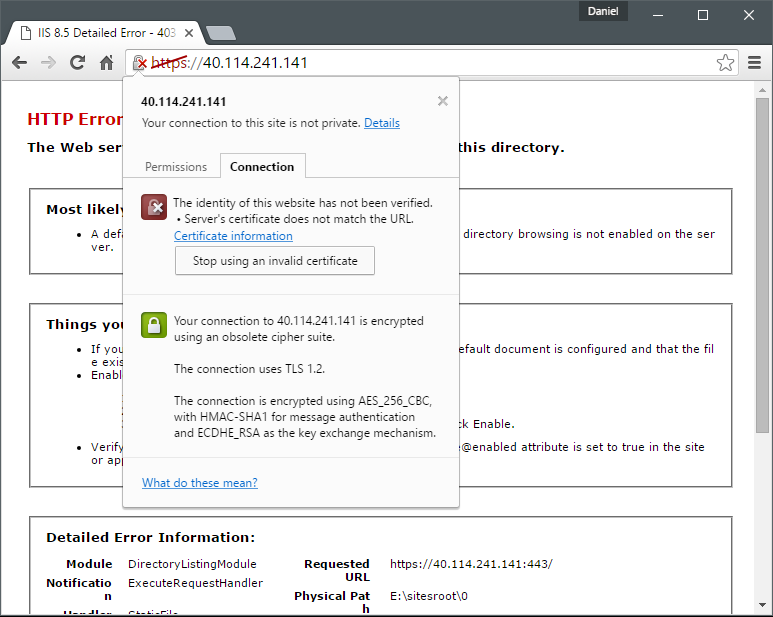
A bit funny though, if you just access the remote host over https you get a certificate warning:
Enough about that. Let's hope that nothing that is profiled is being "leaked".
Let's get started profiling
Enough sidetracks for now. Let's get started profiling! To use Prefix, you just install, activate and the enable the profiler. That's it. There are no specific NuGet packages or anything that you actually do need to install.
After enabling you get guided with links to the docs on any additional steps that might be needed.
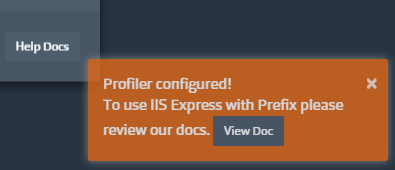
Like if you are profiling an ASP.Net MVC and an ASP.Net WebAPI hosted in IISExpress via Visual Studio 2015. Then you can enable this by e.g. updating [your src folder]\.vs\config\applicationhost.config. All you need to do is to add the module registration as specified in the docs.
<system.webServer>
    <modules>
        ...
        <add name="PrefixModule_Net40" type="StackifyHttpTracer.StackifyHttpModule,StackifyHttpTracer, Version=1.0.0.0, Culture=neutral, PublicKeyToken=93c44ce23f2048dd" preCondition="managedHandler,runtimeVersionv4.0" />
    </modules>
</system.webServer>
Then restart Visual Studio and fire up e.g. ASP.Net MVC or an WebAPI and "Voilà! It works!".
The journey continues
The journey continues with a look at what we actually get profiled and how it supports SQL-queries, MongoDB, logs etc. But that's for next time. In the mean time, here are some official links:
- Screencast: http://stackify.com/prefix-walkthrough/
- Documentation: http://support.stackify.com/hc/en-us/articles/207773453-Prefix-Overview
Again. My impressions so far:
It's super easy to get started! And you are well taken care of, being guided to docs on what to do next.
//Daniel

